TL;DR: using print totals, grading data, and pull rates, I estimate copies printed for every hit card since 2017; for example, roughly 49,000 copies for Umbreon VMAX (aka Moonbreon) from Evolving Skies. Try the Pokémon Card Supply Calculator for yourself.
Once again, the Pokémon card mania is surging and I’ve been swept up in the craze. With all the hype and speculation around astronomical Pokémon card prices and valuation going to the moon, I set out to find a way to systematically estimate how many copies of a given card have actually been printed.
While official yearly, aggregate print run numbers are readily available via The Pokémon Company (TPC), numbers around specific sets and cards are not. Some prior attempts at estimating print run and production numbers have yielded some interesting findings, and this is yet another attempt to expand upon those efforts.
Methodology
The approach I took was to formulate Pokémon card supply as a Fermi problem, and to use readily available quantities along with proxy data for estimation. Concretely, the number of copies printed for a given card is estimated as:
Visually, here’s what that looks like for the Umbreon ex and Espeon ex Special Illustration Rares (SIRs) from the Prismatic Evolutions set:
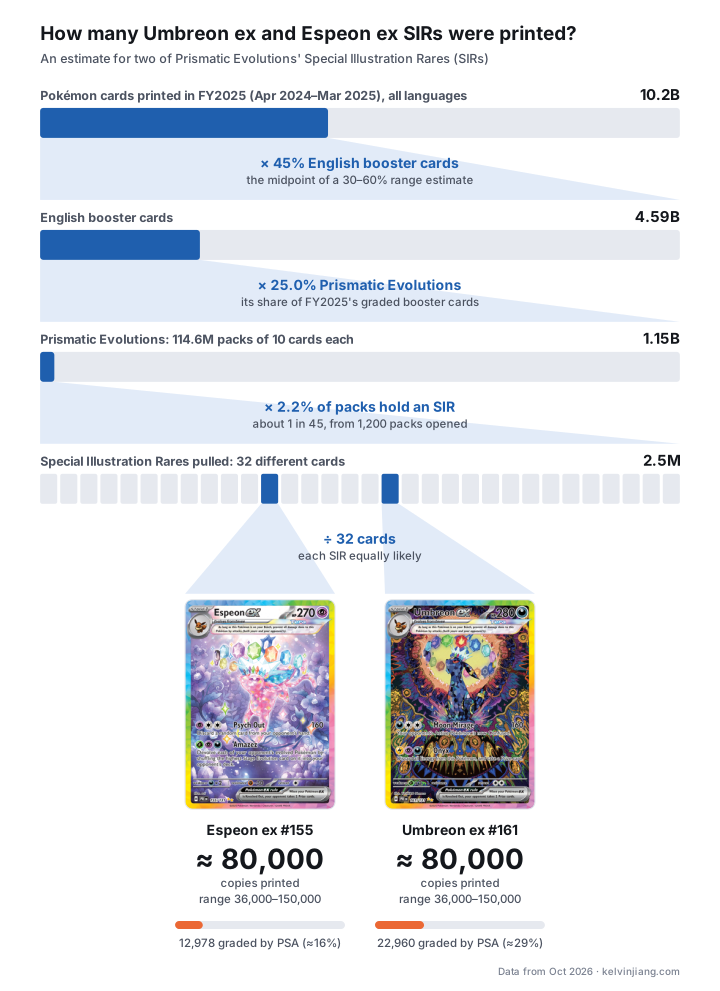
Each term in the formula can be broken down as follows:
- The number of total cards printed is a reliable, well publicized data point that has been available since 2017. Various journalistic sources have also been able to corroborate the official numbers published by TPC. Note that these numbers are for the fiscal year, which for TPC starts in April and ends in March of the following year.
- Share of English cards for booster packs: this is a large unknown and is the key assumption for the reader to adjust. The analysis is limited to boosters since cards that are not pulled from packs (e.g. promotions) do not have pull rates nor pack counts.
- The fraction of graded cards, for each set, out of all the graded cards in each year (from PSA) is used as a proxy for the share of each set. The simplifying assumption is that all sets have equal grading propensity. The tool has a dial to give special sets, which are known to receive more grading submissions, extra weight.
- Cards per pack: straightforward and self-explanatory.
- The pull rate for each set is based on empirical, crowdsourced rates for different card rarity levels in each set. The number of cards in each rarity level for each set is published along with the set list when a new set launches.
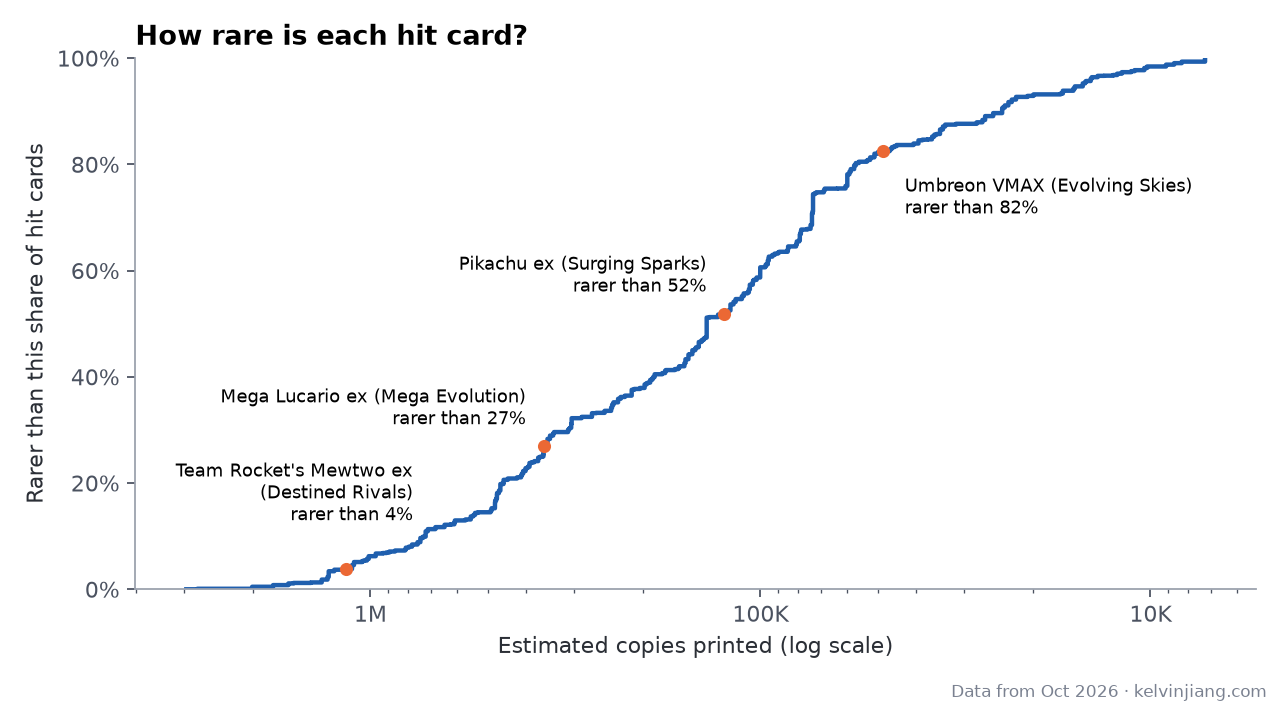
Since there are no published numbers on card copies, there’s no ground truth for the estimates on absolute copy counts to be compared against. However, relative comparisons can be useful, and since every hit card (i.e. Double Rare and up) has an estimate, a ranking of all cards can be used to compare relative card count sizes.
Here’s a comparison of the rarity of well known hit cards plotted against over 3,000 hit cards. For example, the Moonbreon card is estimated to have fewer copies than 82% of hit cards, whereas Team Rocket’s Mewtwo ex has been printed more than 96% of hit cards.
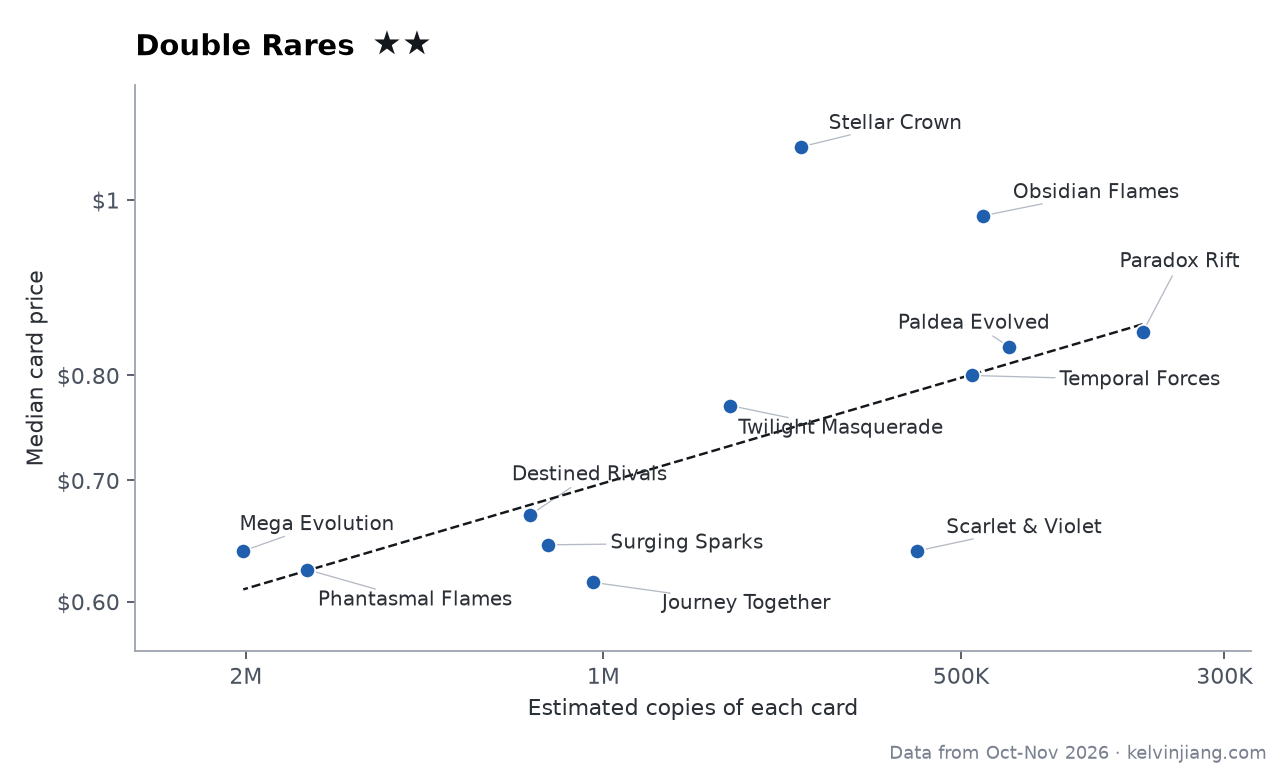
Another point of interest is how the estimated number of copies relates to the price of each card. Hobbyists are well aware of rarity level and its correlation with prices, and from the data we see that the number of copies is also associated with the price. In other words, cards within the same rarity level exhibit variations in price associated with the number of copies printed.
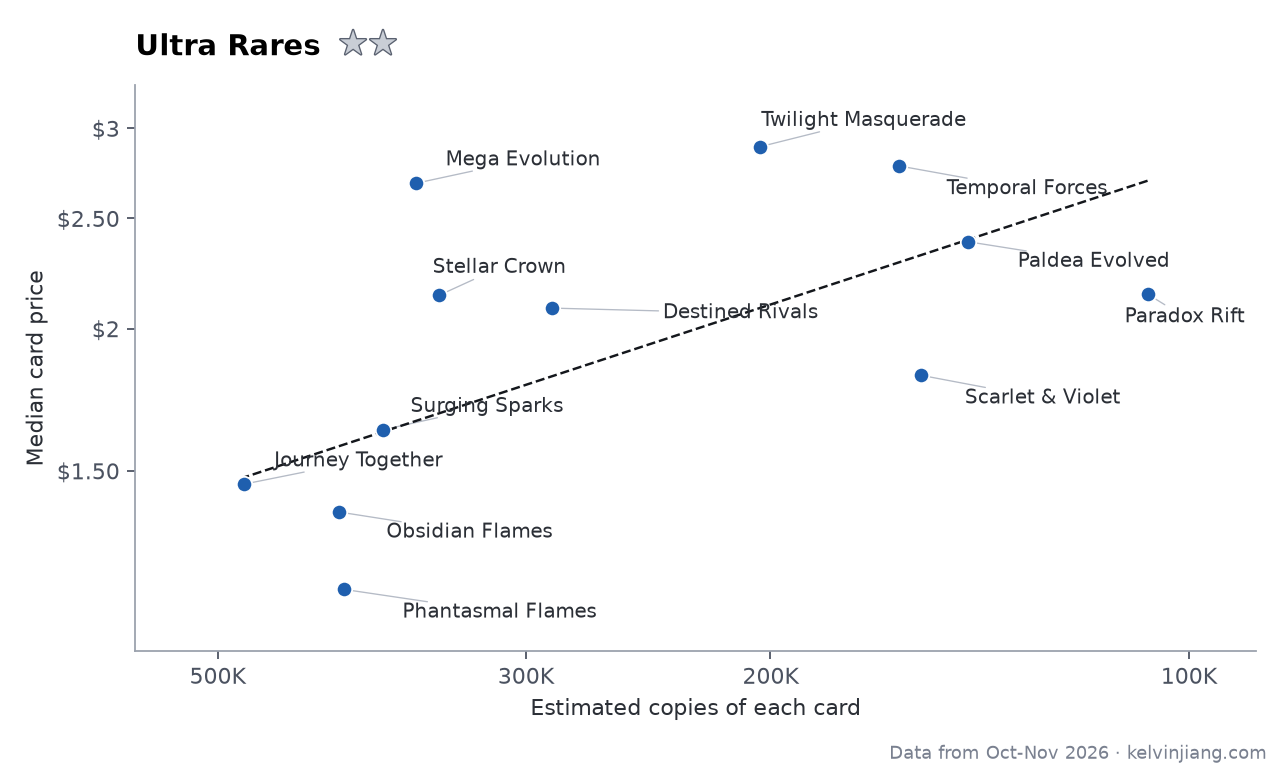
In the following graphs, each dot is one main set from either Scarlet & Violet or Mega Evolution, and the price (from TCGplayer, raw) is the median price of cards within that rarity for that set. Special sets are ignored due to the likelihood of over estimates from grading propensity. For Double Rares, 50% fewer copies goes with roughly 1.1× increase in price:
For Ultra Rares, halving copies roughly increases prices by 1.3×:
And for SIRs, the increase in price is around 1.7×:
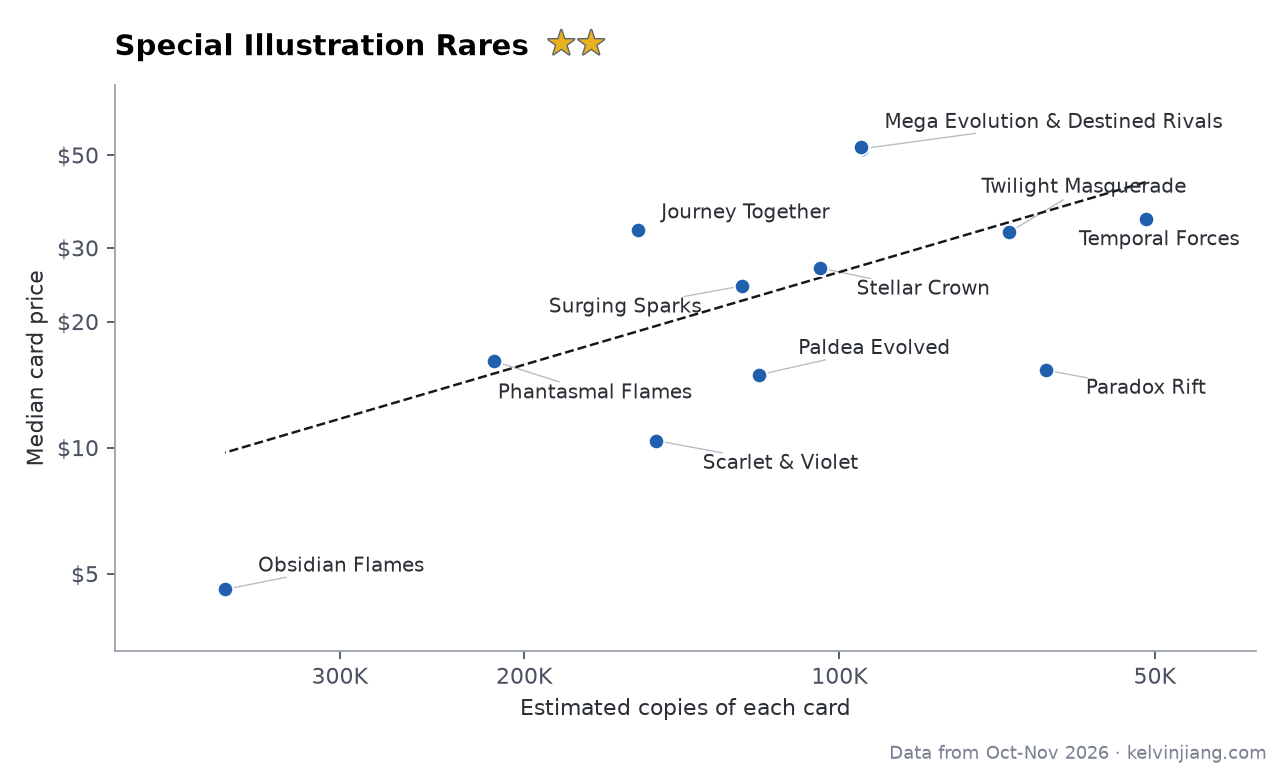
However, it’s important to note that the desirability of each card itself (e.g. the actual Pokémon on the card) likely contributes the lion’s share to the price.
Caveats
When all’s said and done, the key thing to remember is that the tool has a bunch of limitations. I’m applying a fair bit of guesswork to arrive at reasonable, evidence-backed numbers that are most useful for relative comparisons. Some specific caveats to keep in mind:
- Grading data can be skewed towards valuable, popular, or special sets and also subject to hype and speculation.
- Share of English booster cards is the largest unknown.
- Pull rate data may suffer from low sample size.
- Reprints of earlier sets count toward totals for later years, so cards from reprinted sets are undercounted.
With those limitations in mind, I encourage the reader to give the Pokémon Card Supply Calculator a try. All the data used in this writeup are from October and November of 2026. Credit for the data used in this writeup and the tool goes to TPC, PSA, TCGplayer, and Elite Fourum contributors; I have no affiliation with any of the aforementioned entities.