
A few months ago, I stumbled across the Facebook Engineering Puzzles page. I had come across some of the older puzzles before - I vaguely remember one about movie theater seating and another about escaping from velociraptors - but just kind of ignored them. This time around, I decided to give the Liar, Liar puzzle (liarliar) a try (note: Facebook took down the original puzzle so I’m linking to another site with the description). After I scribbled some stuff on paper, I had a very satisfying “a-ha” moment when I recognized the puzzle as a 2-color graph coloring problem. After a bit of review on graph coloring and bipartite graphs, I wrote up a solution, submitted it, and successfully solved the puzzle. After that, I was hooked.
So for the next few weeks, I went on a puzzle binge, solving puzzles in between watching episodes of Lost on Netflix (I had just gotten hooked on the show as well; the show is puzzling in its own way). The puzzles were extremely fun and quite educational. I was able to brush up on some graph theory and dynamic programming, and learned about cool new things like kd-trees.
After I solved a bunch of the puzzles, I was at a nice stopping point and had the ambitious goal of writing up the solutions and putting together some kind of programming puzzle book. I didn’t get too far, but I do have a decent amount of content. I’ve decided to go ahead and just post the various “chapters” in the next few weeks and share them with fellow puzzle lovers. Note that for some puzzles I tried to reword the problem to give it a different flavor; nevertheless, the solutions are pretty much the same.
Since I had been riding the Ruby train for a while, I submitted most of my solutions in Ruby. Using Ruby helped me keep my solutions neat, compact, and easy to read. However, there were some puzzles where I ran into performance problems, but we’ll sideline that for now.
For those of you just finding out about the puzzles - take some time and try them out! Even though it’s obviously a recruiting tool for Facebook, there’s no downside to giving it a go. The Facebook recruiters won’t start harassing you or come knocking on your door - I think it just helps if you eventually decide to apply for a job. The puzzles are just fun; and that feeling you get when you hit the “Eureka!” moment is what computer science is all about.
Without further ado, here’s the piece about Liar, Liar, which is essentially an exercise dealing with bipartite graphs. I decided to give the problem a bit of a scifi spin.
10 Types of People
“There are only 10 types of people in the world: those who understand binary, and those who don’t.” This is an old mathematics joke that most programmers have heard already. Now, let’s get a little more scifi and suppose that you’re an inhabitant on a small planet where an understanding of binary is of utmost importance.
One particular quirk about the citizens of this planet is that anyone who understands binary knows who else understands binary, and who does not. On the other hand, any person that does not understand binary always gets it wrong: if he or she thinks a person understands binary, then that person actually doesn’t, and vice versa.
The governing organization on this small planet performs a census every year to tabulate the level of binary understanding in the population. However, since it’s a census, they have impartial data collected in a strange manner. The census workers go around asking each person for a list of people they know that do not understand binary. Each person responds with a list of people that they claim are clueless about binary. Although it is a small planet, not everyone knows everyone else, so the lists are not going to be complete.
As a responsible citizen, you are curious as to just how many people understand binary, and how many do not. Given the impartial census data, find the size of each group of people.
A Planet Divided
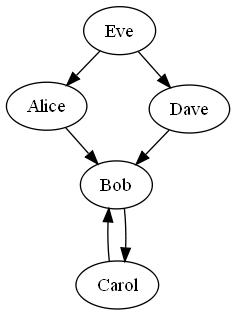
We can break this puzzle down by first examining an example. Suppose there are only five people on the planet: Alice, Bob, Carol, Dave, and Eve. The census data we have on hand is incomplete, and the raw data collected by the census worker looks like this:
Alice claims Bob does not understand binary.
Bob claims Carol does not understand binary.
Dave claims Bob does not understand binary.
Carol claims Bob does not understand binary.
Eve claims Alice and Dave do not understand binary.
Since we are dealing with a binary world where everybody either understands binary or doesn’t, it seems reasonable to try to examine the data with a binary decision. We can assume two worlds: one in which Alice understands binary, and one in which Alice does not understand binary. How will these two worlds differ?
In the first world, since Alice understands the binary system, she has a perfect knowledge of everyone else’s level of understanding. Thus, her claim that Bob does not understand binary must be true. Since Bob does not understand binary, his knowledge of everyone else’s level of understanding is always wrong. Thus, his claim that Carol does not understand binary must be false; Carol actually understands binary just fine. Since we’ve already established that Bob does not understand binary, Dave’s claim in the census data is true, and therefore he must also have a perfect understanding of binary. Finally, since Eve made a bold claim that both Alice and Dave do not understand binary, which we know to be incorrect in this world, Eve must not understand binary either.
By fixing the world on a single assumption about a person’s knowledge, we can logically infer the level of understanding of all the other citizens based on the claims made in the census. At this point, we can apply the same logic to a world where Alice does not understand the binary system. When we combine the results of examining both worlds, we arrive at the the following conclusions:
| Alice | Understands | Does not understand |
|---|---|---|
| Bob | Does not understand | Understands |
| Carol | Understands | Does not understand |
| Dave | Understands | Does not understand |
| Eve | Does not understand | Understands |
In both cases, the two groups of people are of size 3 and size 2, which is the answer to this example problem. Note that we don’t particularly care about how many people understand or don’t understand binary, but rather how the groups are divided. In fact, we can’t actually distinguish between the two groups due to the ambiguity of the data.
Binary Partition
Let’s visualize the raw census data in a graph. Each citizen can be represented by a vertex, and a directed edge (u, v) represents the piece of census data that indicates person u claimed that person v does not understand binary.
If we apply our previous logic to the graph, we would start a graph traversal at Alice. If we assume Alice understands binary, then we know that everyone Alice mentions on the census does not understand binary; likewise, if we assume Alice doesn’t understand binary, everyone Alice mentions on the census does understand binary. In terms of the graph, this is equivalent to marking Alice as being in one group, and all of Alice’s neighboring vertices as in the other group. If we do this by coloring each vertex, it’s easy to see that this problem becomes a graph coloring problem with two colors. That is, the problem of assigning each vertex one of two colors such that no two adjacent vertices share the same color.
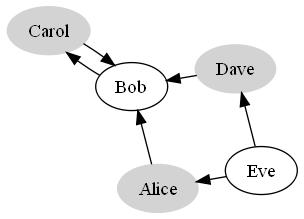
In fact, if we group the different colored vertices together visually, we’ll see that all the edges connect vertices in one group to vertices in the other group, which is also known as a bipartite graph. It turns out that all the graphs in this problem will be bipartite because of the binary division in the citizens and the relationships within the population itself.
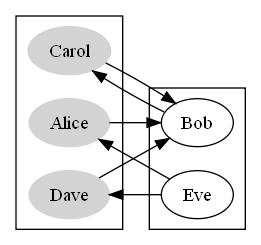
Now that we’ve established the fact that we’re dealing exclusively with bipartite graphs, we can simply use breadth-first search to find the size of each set of vertices. We can represent the graph of raw census data with an adjacency matrix, where the keys are the names of the citizens and a value represents that there’s an edge from the first citizen to the second.
Our breadth-first search algorithm will start at an arbitrary vertex, mark it to be in one group, and then mark all its unvisited neighbors to be in another group. Since neighboring vertices cannot be in the same group (have the same color), directed edges are no longer relevant; we can consider all edges to be undirected. For this exercise, we’ll make the assumption that the data always forms a connected graph, so we don’t have to worry about unreachable vertices. Thus, once the traversal terminates, every vertex will have been visited and marked.
def bfs(graph, start)
  # Keep track of visited vertices
  visited = {start => true}

  # Group vertices into two groups
  group1 = {start => true}
  group2 = {}

  # Maintain a FIFO queue for traversal
  queue = [start]
  while !queue.empty?
    u = queue.shift
    graph[u].keys.each do |v|
      unless visited[v]
        visited[v] = true

        # Mark the vertex to be in different group from neighbor
        group1[v] = true if group2[u]
        group2[v] = true if group1[u]
        queue.push(v)
      end
    end
  end
  return [group1, group2]
end
Putting together a program to solve our example problem is then simply a matter of creating the adjacency matrix from the census data. Once all the vertices in the graph have been marked, the program outputs the sizes of each group of vertices.
#!/usr/bin/ruby
data = {
  'Alice' => { 'Bob'   => true },
  'Bob'   => { 'Carol' => true },
  'Dave'  => { 'Bob'   => true },
  'Carol' => { 'Bob'   => true },
  'Eve'   => {
    'Alice' => true,
    'Dave'  => true,
  },
}

# Treat edges as undirected
start = nil
graph = {}
data.each_key do |u|
  start = u
  graph[u] ||= {}
  data[u].each_key do |v|
    graph[v] ||= {}
    graph[u][v] = graph[v][u] = true
  end
end

p1, p2 = bfs(graph, start)
puts "#{p1.size}, #{p2.size}"
If you enjoyed this post, you should follow me on Twitter @cloudkj. If you’re interested in more puzzle fun, you should check out my posts about various other puzzles, such as Gattaca, Dance Battle, User Bin Crash, It’s A Small World, and Refrigerator Madness.
Food For Thought
- Can the problem also be solved using depth-first search?
Comments